Christmas Sales Analysis Dashboard
Made for Apple in my role as a Data Analyst. Created with artificial data.

Awarded to <0.01% of published vizzes by Tableau's editorial team.

Interactive Dashboard
Hover, filter and switch tabs.
Tableau Viz of the Day
Featured by Tableau's official account on LinkedIn.
Why this project?
Christmas is a major time for sales around the world, and making the most of the holiday rush can be a bit challenging. In this task, I helped Apple analyse Christmas data to uncover insights into customer behaviors during the festive season. The dataset provided includes anonymized Christmas sales data across various product categories, customer demographics, and marketing campaigns.
These are the questions I was interested in answering
Here are my key takeaways
Children (ages 1–11) contributed nearly 40% of total Christmas sales, with Smartphones and in-store shopping being their top preferences.
The top 5 best-selling products, all for children, declined by up to 15% over four years — highlighting changing consumer trends.
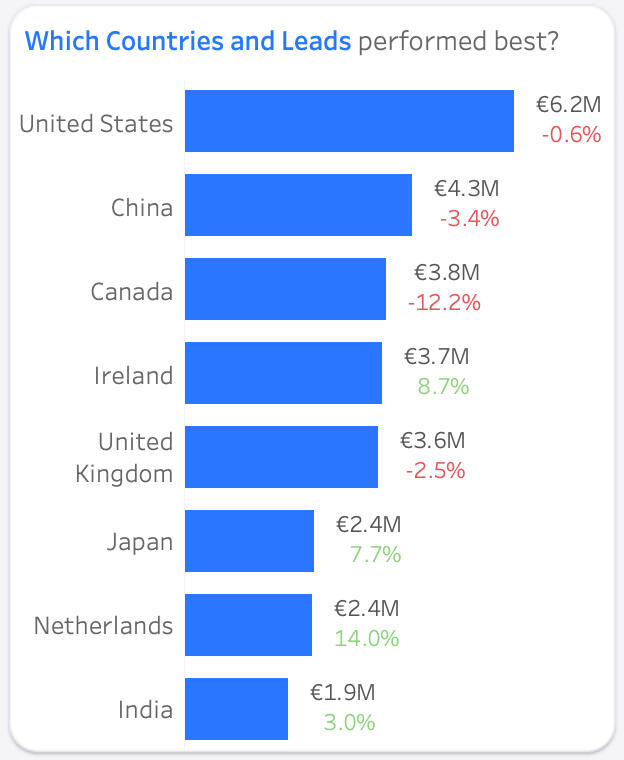
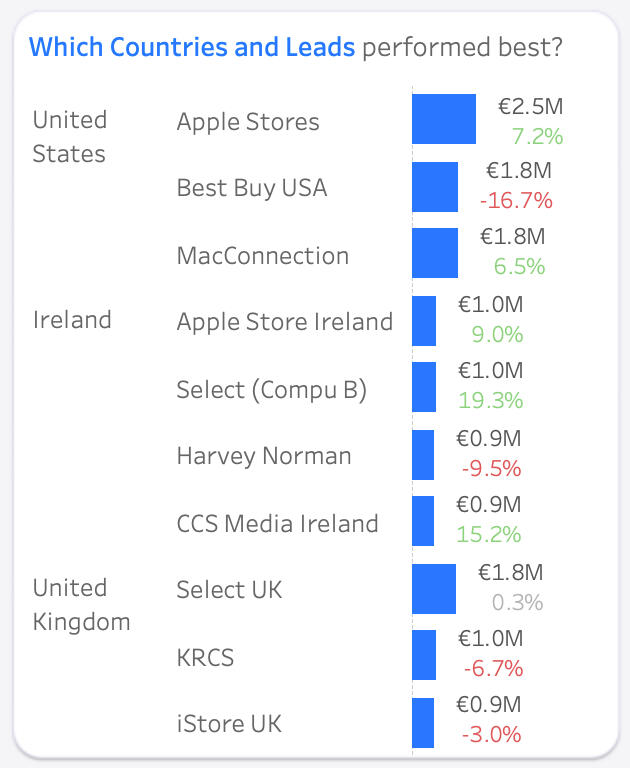
United States led with €6.2M in sales and US Apple Stores leading with €2.5M in sales, while Netherlands grew 14%, and Canada declined by 12% since 2018/2019. Irish Store Select (Compu B) increased sales by 19.3%, which could be targeted for future sales leads.
Covid caused a -3.2% dip in 2020, followed by a +1.9% recovery in 2021, though sales hadn't fully rebounded.
Customers tend to buy 1–5 products per transaction, but when making bulk purchases, they preferred 5, 10, 15, or even 30 items. This suggests an opportunity for special pricing on bulk purchases to encourage upselling.
December accounted for 77% of in-store sales, showing a strong opportunity for seasonal promotions. Shopping timing varied — females preferred Sundays and Mondays, while males leaned towards Thursdays for gift buying.
The Tableau dashboard
Two tabs answer the six questions. Slide between them — or tap either dashboard to zoom in.
Customer Segment tab
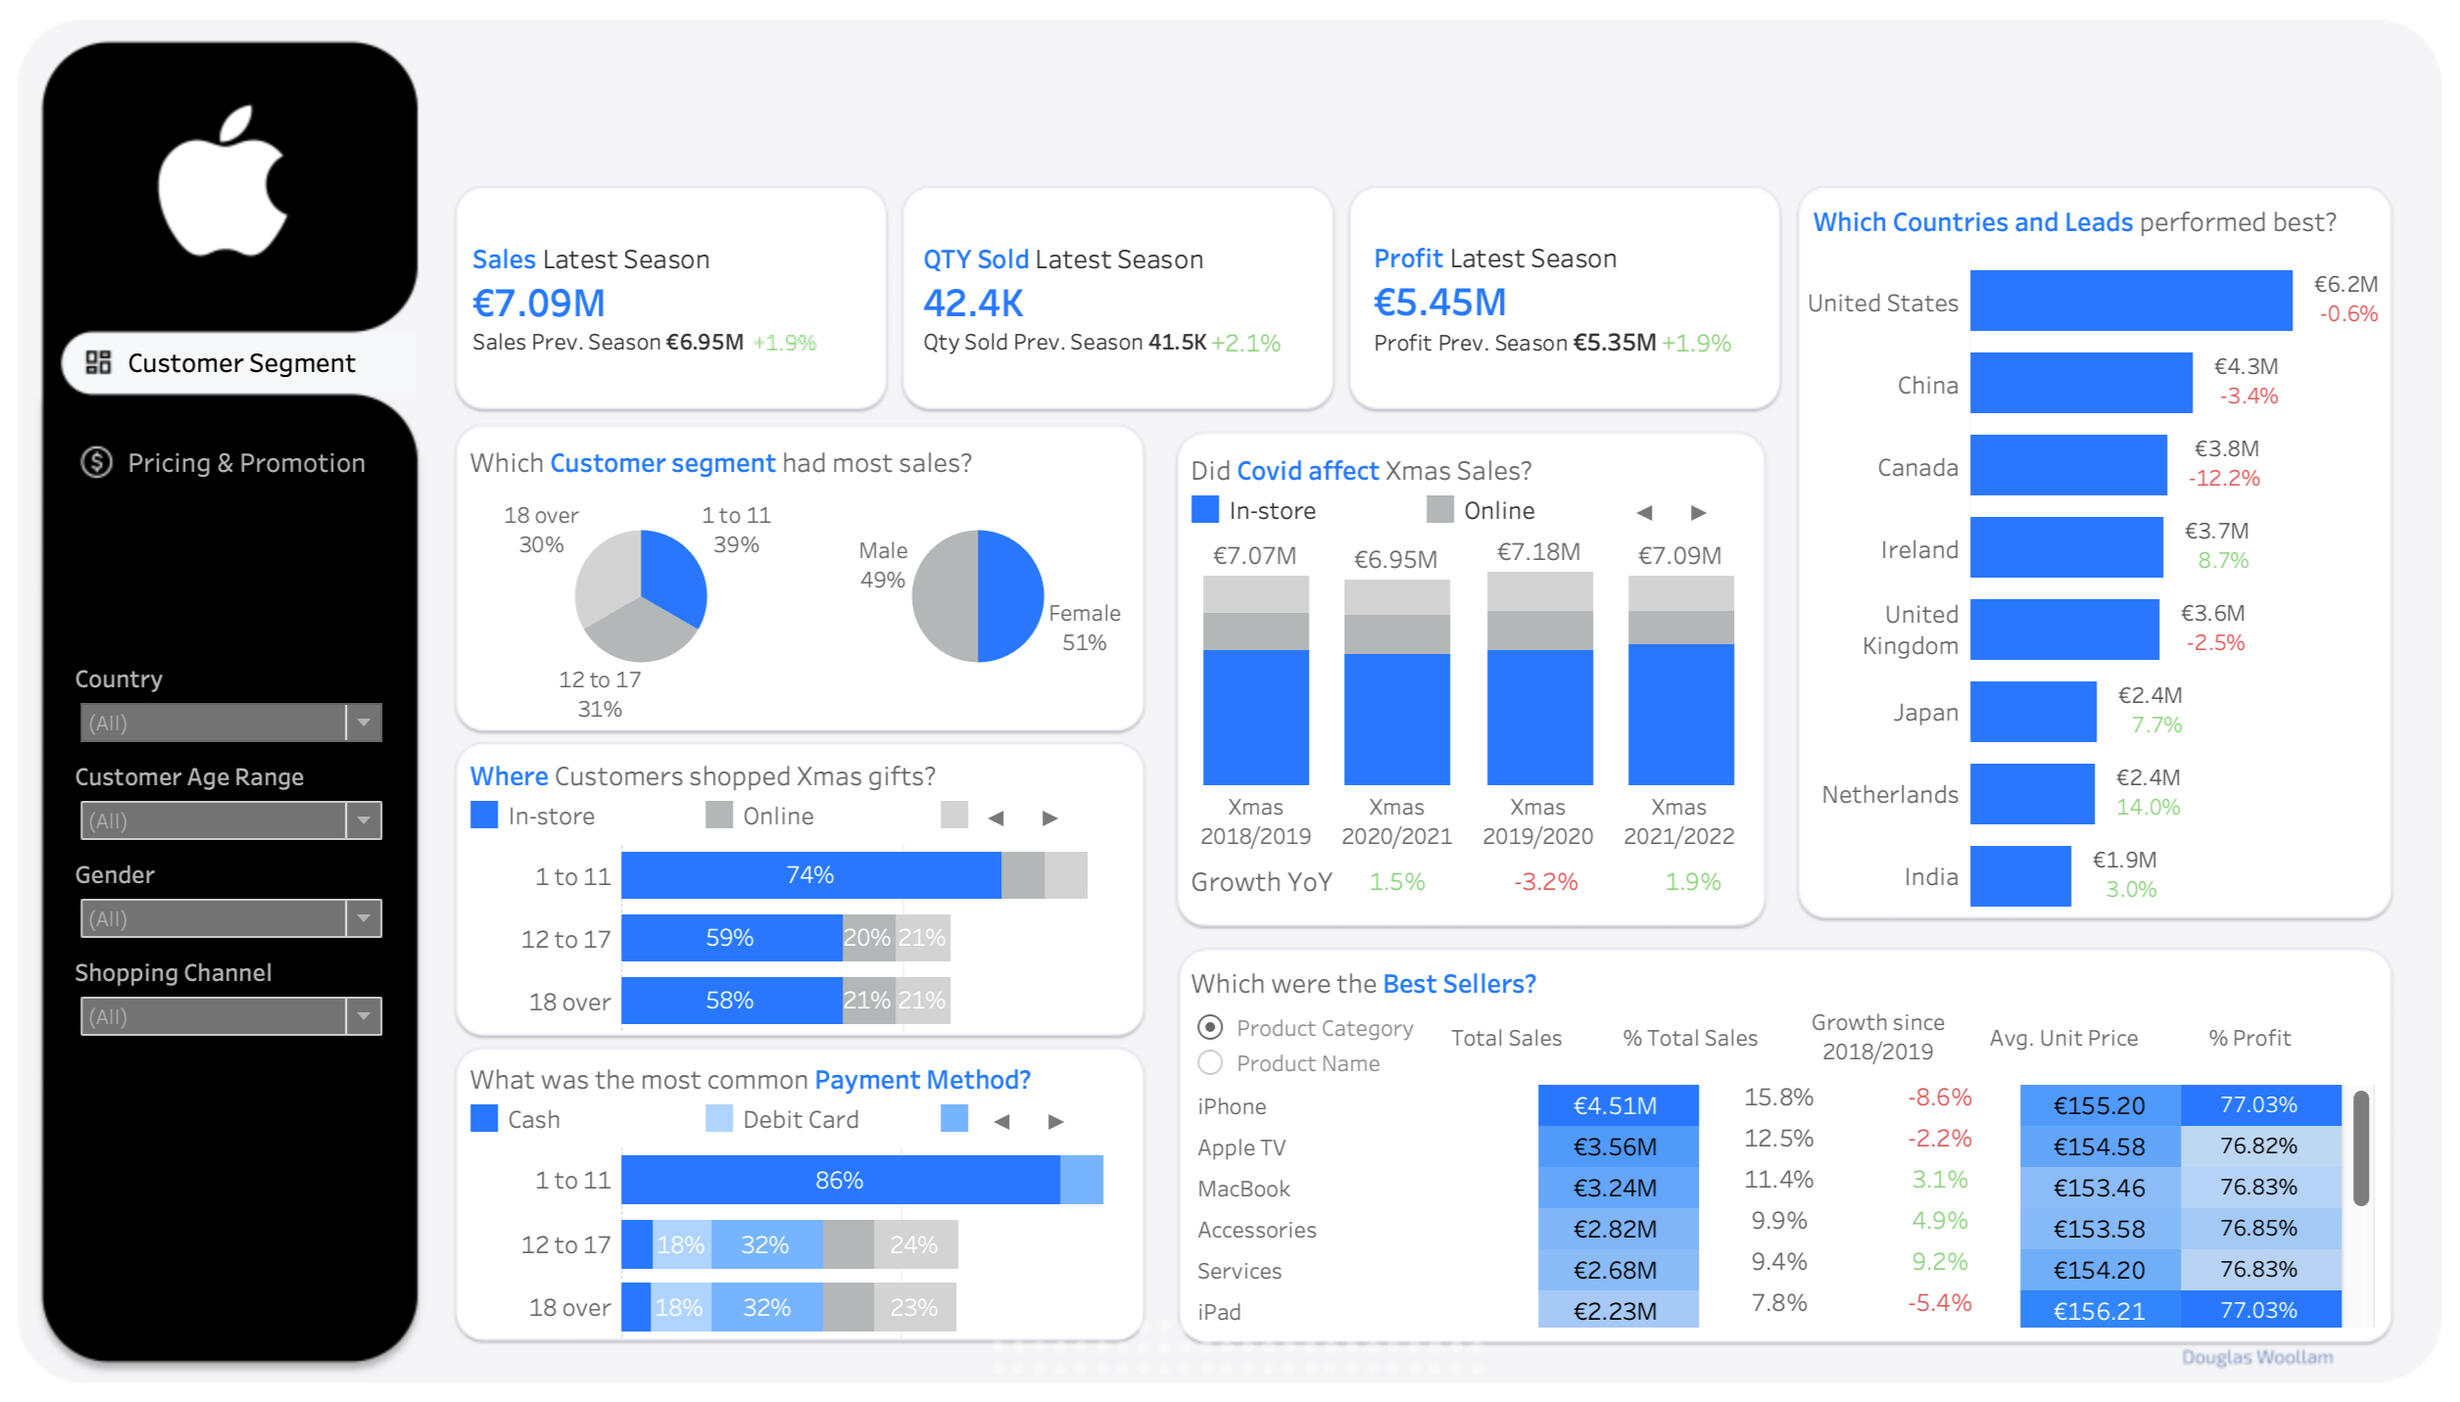
This tab helped answer the questions on Customer Segments, Best Performing Products, Geography, and Covid. It revealed that Children (ages 1–11) contributed nearly 40% of sales, highlighted the decline of top-performing products, mapped regional performance, and showed how sales dipped during the pandemic.
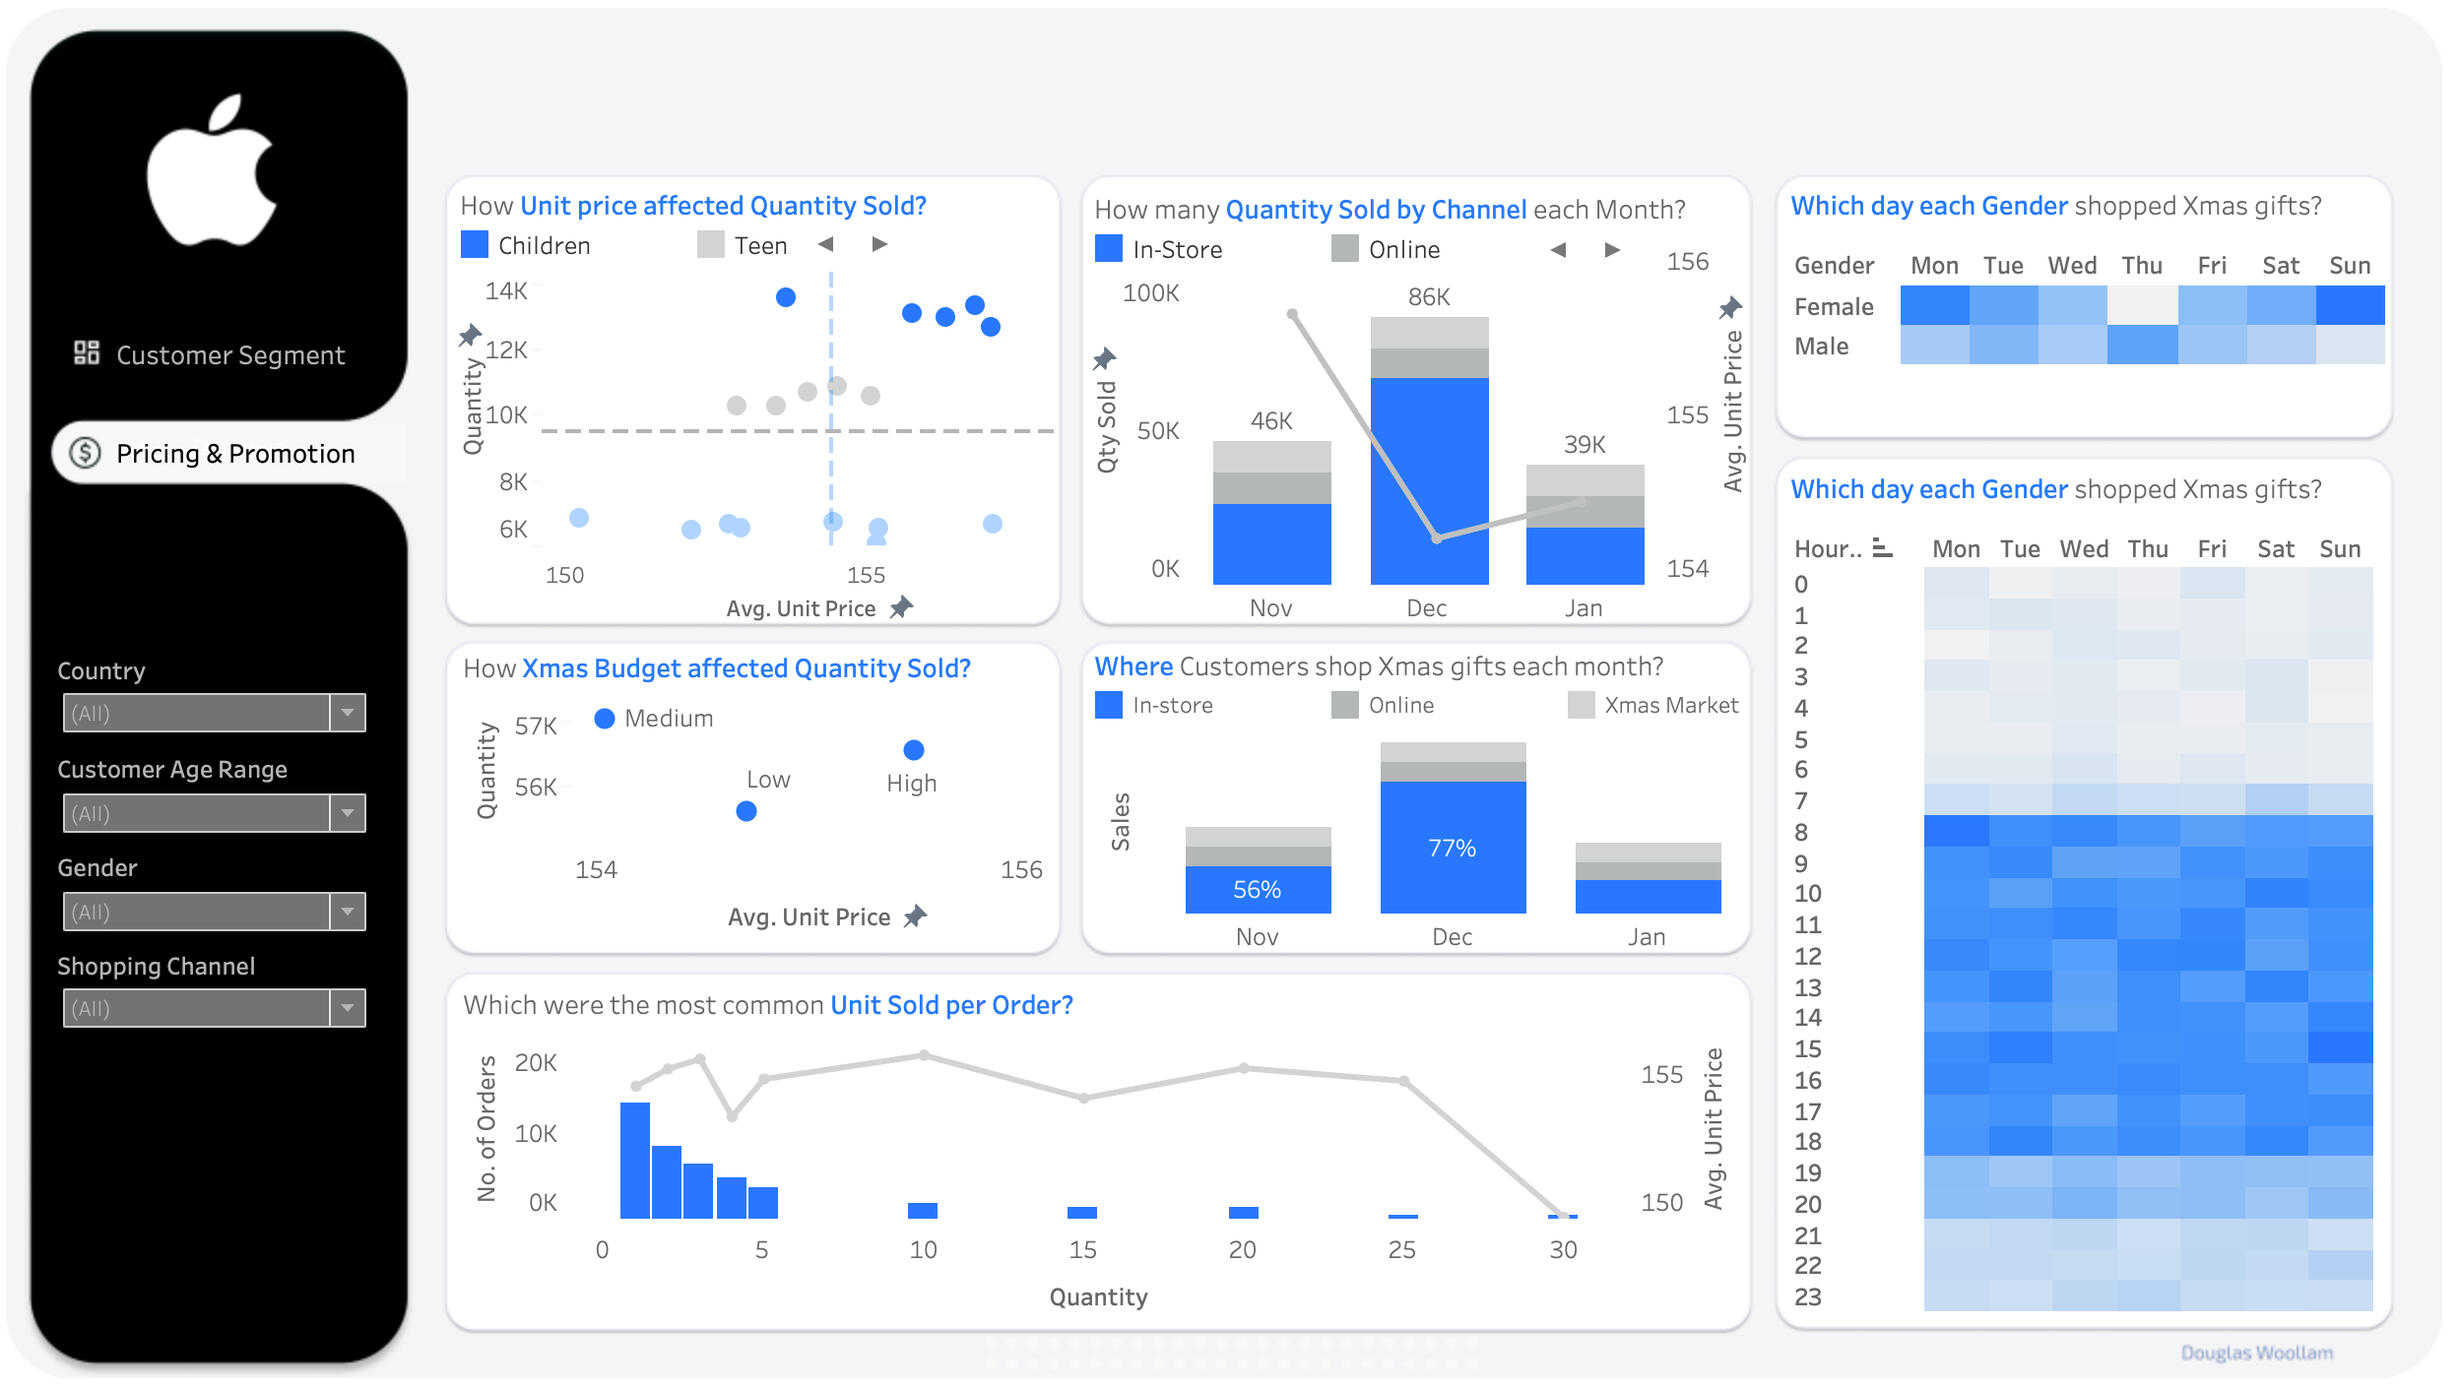
Pricing & Promotion tab
This tab helped answer the questions on Pricing and Shopping Timing. It analyzed how price variation affected sales, identified bulk promotion opportunities, and pinpointed December's 77% in-store sales share as the key window for promotions.
Data Cleaning
Instead of looking at the data by calendar year, data was grouped into Christmas Seasons to get a better understanding. For example, November 2018, December 2018, and January 2019 are combined into Xmas 2018/2019, considering these three months as one season for retailers and shoppers alike.
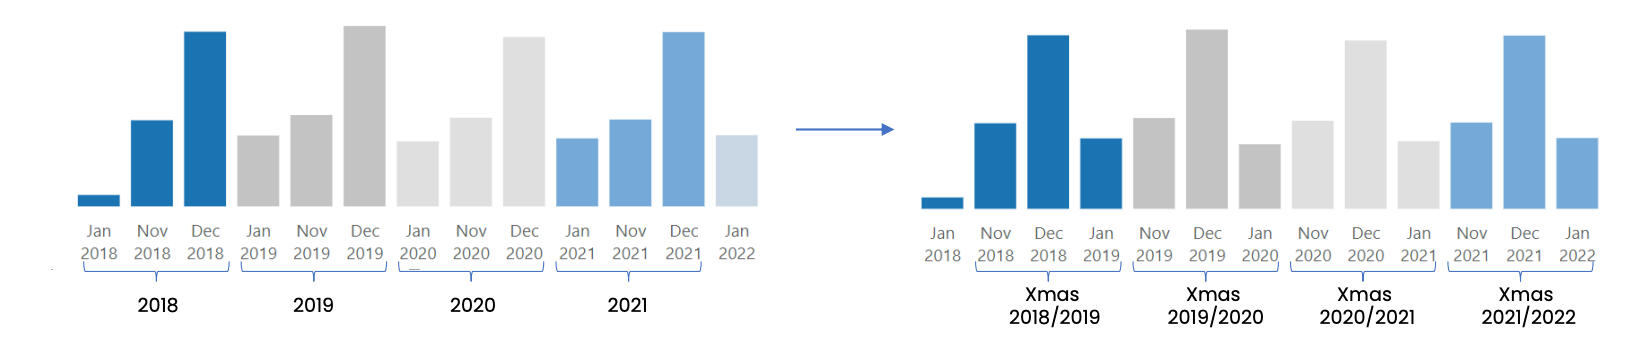
- To make things more business-friendly, some fields were given new names. For example, Purchase Type (In-store, Online, Xmas Market) is now Shopping Channel.
- Since most of the data is from EU countries, I assumed Euro as the currency. In the real scenario, this needs to be clarified with the business.
- A Calendar Table was added to enhance time-related analysis.
Analysis
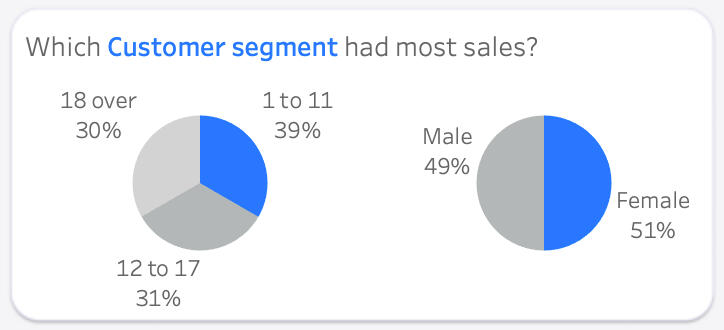
The Children segment (ages 1-11) stood out, contributing nearly 40% of total Christmas sales over the years. Interestingly, there was no significant difference between male and female customers across different age groups.
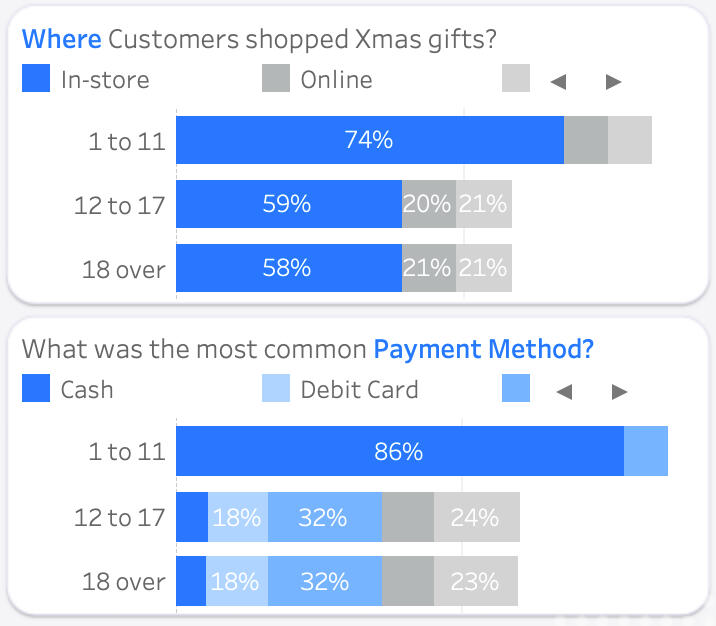
In-store shopping, particularly for the Children segment (74% in stores), was a prevalent choice. This is understandable as kids often prefer the hands-on experience of selecting gifts. Cash was the preferred payment method for Kid purchases, while Teens (ages 12–17) and Adults (ages 18 and over) leaned towards credit card, and cash was their least preferred payment method.
Overall, iPhone and Apple TV took the lead as the top-selling product categories, contributing a significant 27% to total sales among the 11 categories. While iPhone stole the spotlight as the most beloved and profitable category with a staggering 77.03%, it's important to note that its sales had seen a notable decline in the past couple of years.
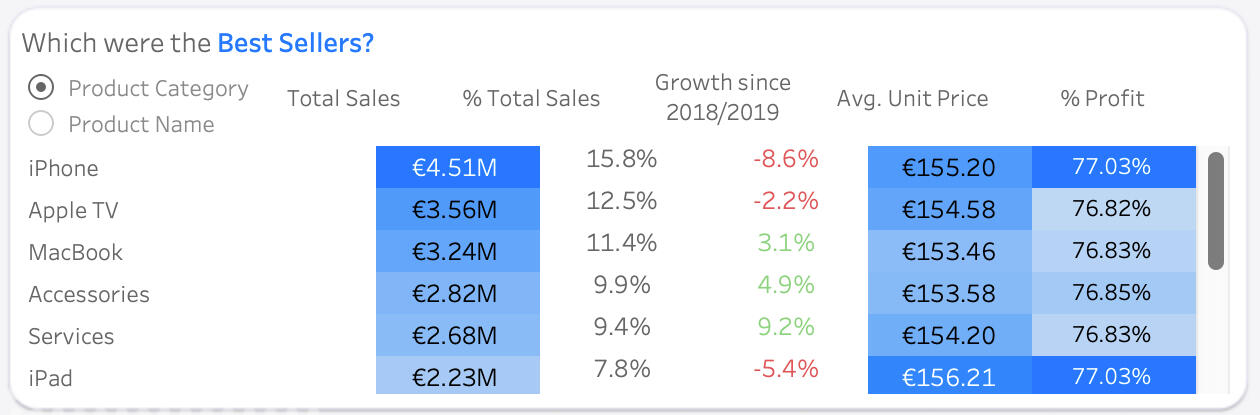
Breaking it down to the product level, Iphone 13 and Iphone SE were the best sellers, each making up 7.9% to the overall sales. Interestingly, the top 5 performers were all targeted at the Children segment. However, despite their initial popularity, all of these products saw a decline in sales, ranging from -2% to -15% over the past four seasons. Zooming in on the Teenager segment, HomePod Mini emerged as the most cherished Christmas gifts. Meanwhile, in the world of Adults, the Apple Watch Series 5 stole the show, contributing the most to sales and enjoying a substantial sales growth of nearly 50% since the Christmas season of 2018/2019.
United States took the crown for the most Christmas sales over the four seasons, reaching €6.2 million. Canada, once the best in Xmas 2018/2019, faced a decline of -12% over the four seasons. The Netherlands showcased the most significant growth of 14%, climbing from the 7th to the 5th spot.
Drilling down to the Sales Leads, the three Stores in United States (Apple Stores, Best Buy USA & MacConnection) emerged as the top-selling Stores, each generating over €1.8 million in sales. In Ireland, Apple Store Ireland & Select (Compu B) emerged as the top-selling Stores, each generating over €0.9 million in sales.
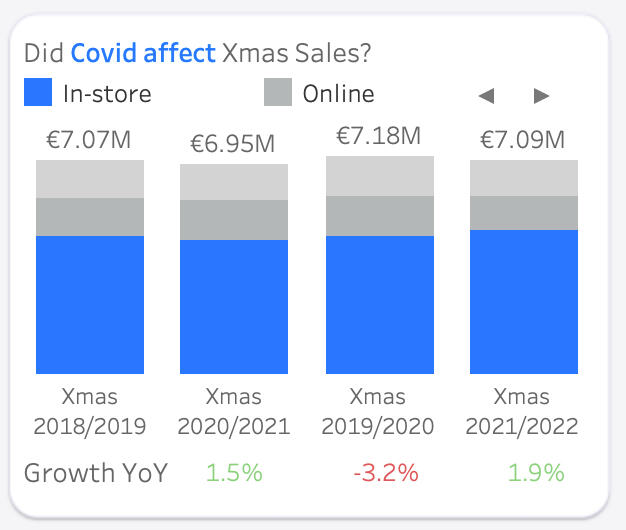
The Christmas gift market felt the impact of Covid in 2020, experiencing a -3.2% sales decrease. A recovery followed in 2021/2022 with a +1.9% increase, but the sales had not yet reached pre-Covid levels.
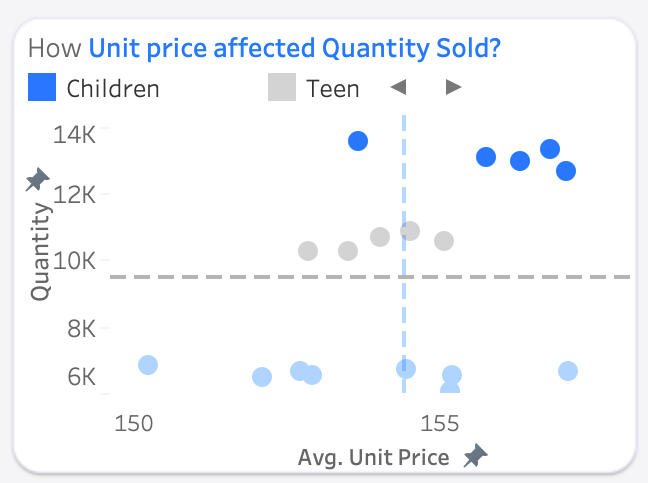
Despite higher prices, children's products lead in sales quantity, with over 12 thousand units sold for each product over the past four Christmas seasons. Among products for adults, unit price variation did not significantly affect the quantity sold (around 6–7 thousand units per product).
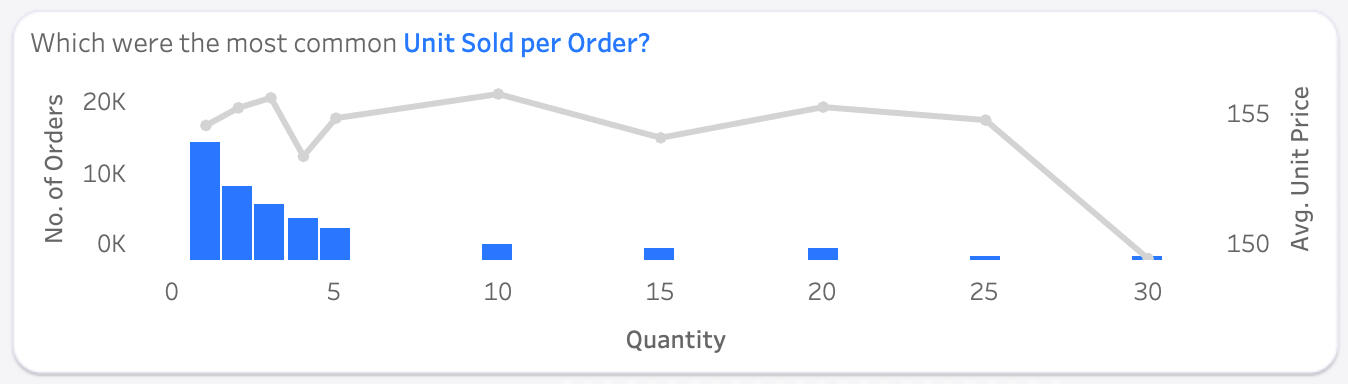
Customers tend to buy 1–5 products per transaction, but when making bulk purchases, they preferred 5, 10, 15, or even 30 items. This suggests an opportunity for special pricing on bulk purchases to encourage upselling.
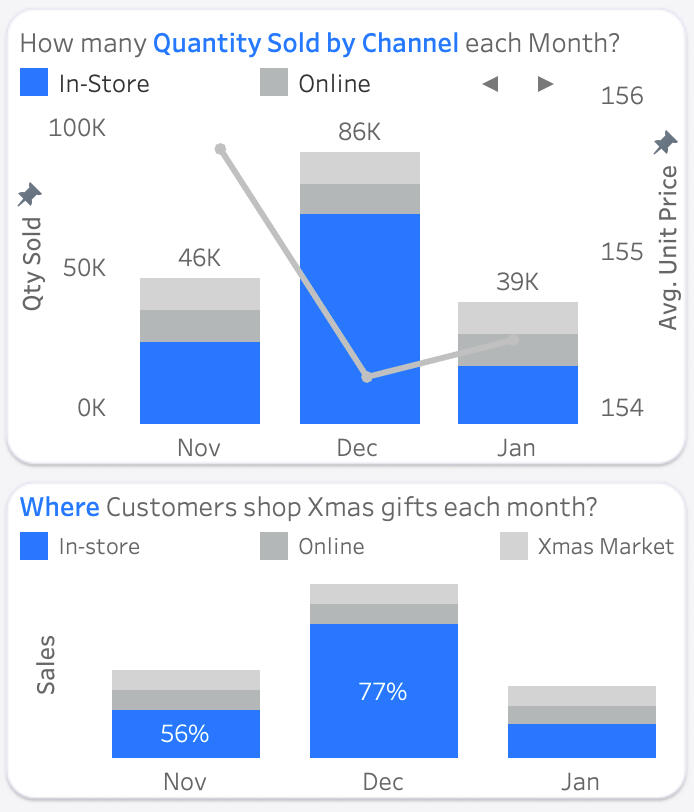
December was the busiest month for Christmas gift shopping, with sales doubling compared to November and January. In-store shopping dominated December, accounting for 77% of sales, making it an excellent time for in-store promotions.
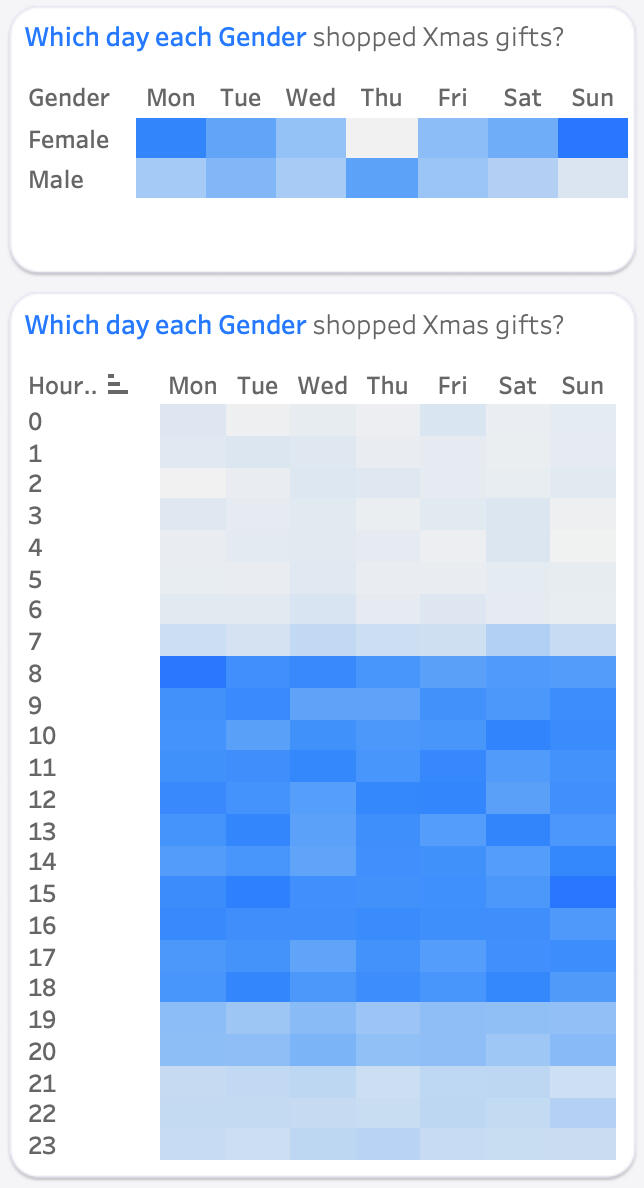
Shopping times varied across different channels. In-store shopping peaked on Monday, followed by Sunday. Sundays at 3 pm became the busiest time for Christmas markets. Online shopping provided flexibility, with peak times at Monday 8 am, Wednesday 11 pm, and Saturday 7 am. Weekday afternoons at 4 pm witnessed the highest online sales. While females preferred Sunday and Monday for Christmas shopping, males leaned towards Thursdays for their festive gift-buying spree.